In the digital age, music streaming has become an integral part of our lives, and platforms like Spotify have revolutionized the way we access and enjoy music. While Spotify offers an array of features to explore and interact with your favorite tunes, one creative way to visualize your listening habits is by creating a Spotify Pie Chart. This graphical representation can provide valuable insights into your musical preferences and help you discover new artists and genres. In this comprehensive guide, we will walk you through the process of making a Spotify Pie Chart, addressing common questions and providing step-by-step instructions.
Table of Contents:
- Introduction to Spotify Pie Charts
- Gathering Data from Spotify
- Choosing a Pie Chart Generator
- Creating Your Spotify Pie Chart
- Interpreting Your Pie Chart
- FAQs about Spotify Pie Charts
1. Introduction to Spotify Pie Charts:
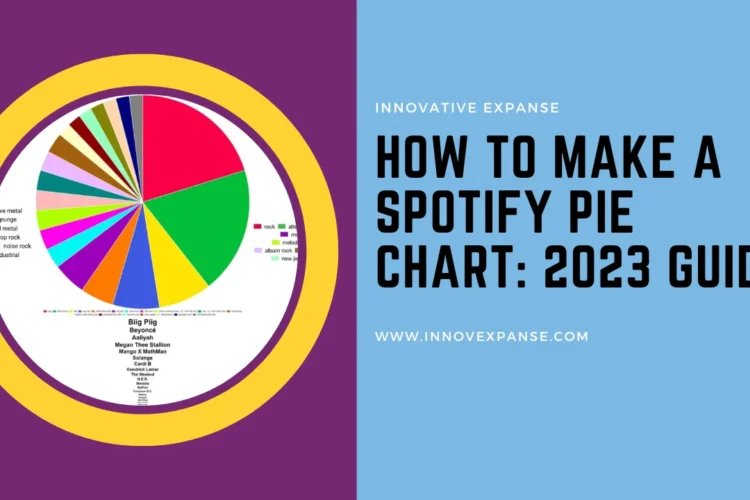
A Spotify Pie Chart is a visual representation of the distribution of your listening habits on the platform. It showcases the percentage breakdown of different genres, artists, or songs you’ve enjoyed over a specific period. Creating a Spotify Pie Chart not only adds a fun and artistic element to your music experience but also offers insights into your personal preferences.
2. Gathering Data from Spotify:
Before you can create a Spotify Pie Chart, you’ll need to collect the necessary data from your Spotify account. Follow these steps to gather your listening data:
- Access Your Spotify Account: Open the Spotify app or visit the Spotify website and log in to your account.
- Request Your Data: Navigate to your Account settings and find the option to request your data. Spotify allows users to download their data, which includes information about your listening history.
- Download Data: Once your data request is processed, you’ll receive an email with a link to download your data. Download and extract the files to a convenient location on your device.
3. Choosing a Pie Chart Generator:
To create a visually appealing and accurate Spotify Pie Chart, you’ll need a reliable pie chart generator tool. There are several online tools available that allow you to upload your data and customize your chart. Some popular options include:
- Google Sheets: If you’re comfortable working with spreadsheets, Google Sheets offers built-in charting capabilities that can help you create a pie chart from your Spotify data.
- Canva: Canva is a user-friendly design platform that offers various chart templates, including pie charts. It’s a great option if you want to add a creative touch to your visualization.
- Plotly: Plotly is a powerful data visualization library that enables you to create interactive and customizable pie charts. It’s suitable for those who are familiar with coding and want more advanced features.
4. Creating Your Spotify Pie Chart:
Once you’ve chosen a pie chart generator, follow these general steps to create your Spotify Pie Chart:
- Upload Your Data: Import the Spotify data you downloaded into the chosen pie chart generator. Depending on the tool, you may need to format the data or select specific columns to use.
- Select Chart Type: Choose the pie chart option from the available chart types.
- Customize Your Chart: Modify the chart’s appearance by selecting colors, labels, and other design elements. You can also adjust the chart’s title and other relevant details.
- Generate the Chart: Click the “Generate” or “Create” button to generate your Spotify Pie Chart based on the data you provided.
5. Interpreting Your Pie Chart:
Once you’ve successfully created your Spotify Pie Chart, it’s time to interpret the results. Here are some key points to consider:
- Genre Distribution: The chart will display the proportion of different music genres you’ve listened to. This can help you discover which genres dominate your playlist.
- Artist Breakdown: If you’ve chosen to analyze artists, the chart will show the distribution of plays among different artists. This might highlight your top-played artists or introduce you to new ones.
- Time Period: Remember that the chart represents a specific time period, so your preferences may change over time.
6. FAQs about Spotify Pie Charts:
Here are some frequently asked questions about creating Spotify Pie Charts:
Q1: Can I create a pie chart for a specific playlist?
Yes, you can! If you’re interested in visualizing the distribution of a particular playlist, make sure to extract the relevant data from your Spotify account.
Q2: How often should I update my Spotify Pie Chart?
It’s recommended to update your pie chart periodically to track changes in your listening habits. You can create charts for different time periods (e.g., monthly, quarterly) to observe trends.
Q3: Are there any privacy concerns with creating Spotify Pie Charts?
The data you use to create the chart is personal and should be handled with care. Ensure that you keep your data secure and avoid sharing it with unauthorized parties.
Q4: Can I share my Spotify Pie Chart on social media?
Yes, many pie chart generators allow you to export and share your charts on social media platforms, providing a fun way to engage with your friends and followers.
Q5: Can I create a pie chart for multiple users’ listening data?
As of now, most tools focus on individual user data. However, you can manually combine data from multiple users if you have access to their listening history.
In conclusion, creating a Spotify Pie Chart is a captivating way to visualize your music preferences and explore your listening habits. By following the steps outlined in this guide, you can transform your Spotify data into an eye-catching and informative visual representation. Whether you’re a data enthusiast, a music lover, or simply curious about your musical tendencies, a Spotify Pie Chart can provide valuable insights and a delightful experience in your journey through the world of music streaming.


0 Comments